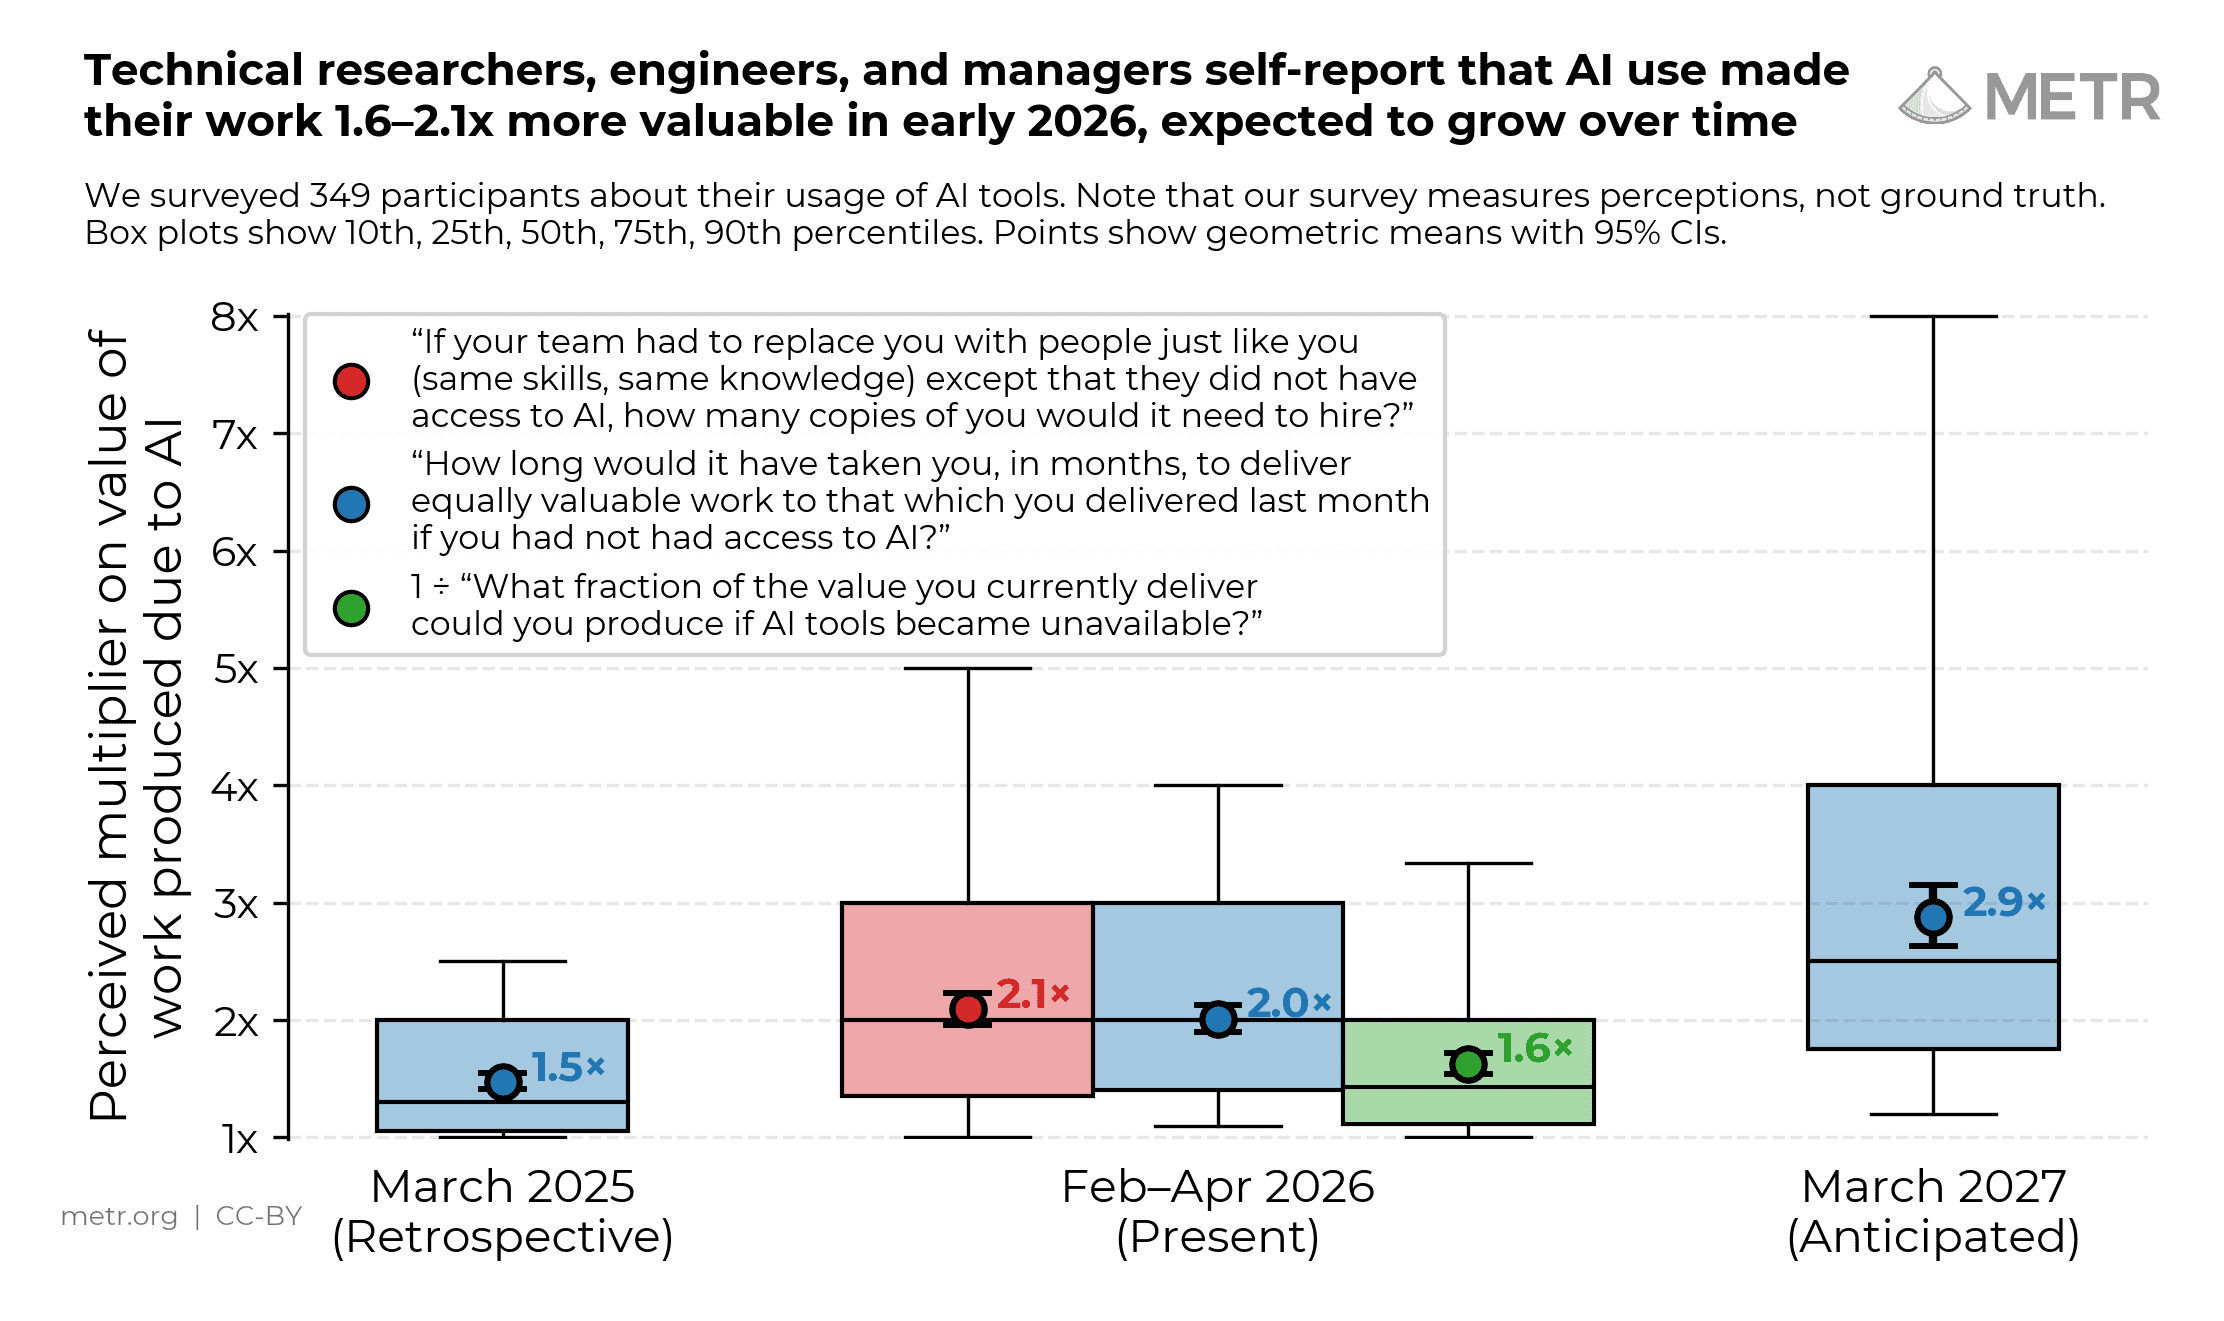
Summary: We describe three different definitions of the productivity impact of AI (AKA uplift), and show there’s reason to expect:
\[\text{uplift on old tasks} \leq \text{uplift in value} \leq \text{uplift on new tasks}\]Three Measures of Uplift
One complication in measuring AI’s effect on productivity is that it has different effects on different tasks, and this causes people to change how they allocate their time between tasks. This makes it more difficult to talk about the effect of AI on overall productivity.
We use “old tasks” to mean the set of tasks you’d do in a typical day before AI is available – your average workday in 2021, say. “New tasks” means the set of tasks you’d do in a typical day after AI is available. Not all new tasks necessarily use AI; they’re just the tasks you choose knowing AI is an option.
We have found it important to distinguish between three measures of AI’s uplift:
Uplift on old tasks: The factor by which pre-AI time exceeds post-AI time to complete the old tasks.
Uplift on new tasks: The factor by which pre-AI time exceeds post-AI time to complete the new tasks.
Uplift in value: The factor by which post-AI value exceeds pre-AI value, allowing for reshuffling of tasks between the pre-AI and post-AI cases. In some cases value has a natural definition; in others, it can be operationalized using related definitions discussed more in the accompanying note.
This note discusses the distinction and its implications for interpreting AI productivity estimates. We also have an accompanying short note with more mathematical details.
Ranking the Three Types of Uplift
Under some simplifying assumptions, the following inequalities hold:
\[\text{uplift on old tasks} \leq \text{uplift in value} \leq \text{uplift on new tasks}\]These inequalities correspond to classic inequalities in the economic theory of price indices, which estimate the effects on welfare of changes in prices based on how consumers change their expenditure in response to the price changes.1
Uplift on old tasks is less than uplift in value because it only accounts for the time savings on your existing tasks; it doesn’t include the benefit you can get from rearranging your time toward tasks that AI has made more efficient.
Uplift on new tasks is more than uplift in value for the opposite reason: it handicaps the measure of pre-AI productivity by using the post-AI task mix. The new tasks can include tasks that you would never have attempted pre-AI, and so the pre-AI time required can be large, meaning the uplift in time will be bigger than the uplift in value.
These inequalities hold for decision-makers who allocate their time across tasks to maximize some objective, given accurate beliefs about task-level uplift. There are many other practical difficulties that make it challenging to estimate uplift in practice.2
A Simple Example
Suppose a software engineer is deciding how to spend their 8-hour workday. They can do two tasks, each of which takes an hour: (1) writing a document; (2) writing a pull request (PR).
Suppose AI increases their productivity at writing PRs by a factor of two, but does not change their productivity at writing documents. Finally, suppose that they spend the same amount of time on both activities pre-AI and post-AI.
| Task | Pre-AI time cost | Pre-AI allocation | Post-AI time cost | Post-AI allocation |
|---|---|---|---|---|
| Writing documents | 1 hour per document | 4 documents | 1 hour per document | 4 documents |
| Writing pull requests | 1 hour per pull request | 4 pull requests | ½ hour per pull request | 8 pull requests |
We can calculate uplift as the ratio of pre-AI time required to post-AI time required:
\[\text{Uplift on old tasks} = \frac{4 \text{ docs} \times 1 \text{ hr/doc} + 4 \text{ PRs} \times 1 \text{ hr/PR}}{4 \text{ docs} \times 1 \text{ hr/doc} + 4 \text{ PRs} \times 0.5 \text{ hr/PR}} = \frac{8 \text{ hr}}{6 \text{ hr}} = +33\%\] \[\text{Uplift on new tasks} = \frac{4 \text{ docs} \times 1 \text{ hr/doc} + 8 \text{ PRs} \times 1 \text{ hr/PR}}{4 \text{ docs} \times 1 \text{ hr/doc} + 8 \text{ PRs} \times 0.5 \text{ hr/PR}} = \frac{12 \text{ hr}}{8 \text{ hr}} = +50\%\]Under some simplifying assumptions (more details in the accompanying note) the uplift in value will be between \(+33\%\) and \(+50\%\), but the exact value will depend on how substitutable pull requests vs. documents are to the engineer.
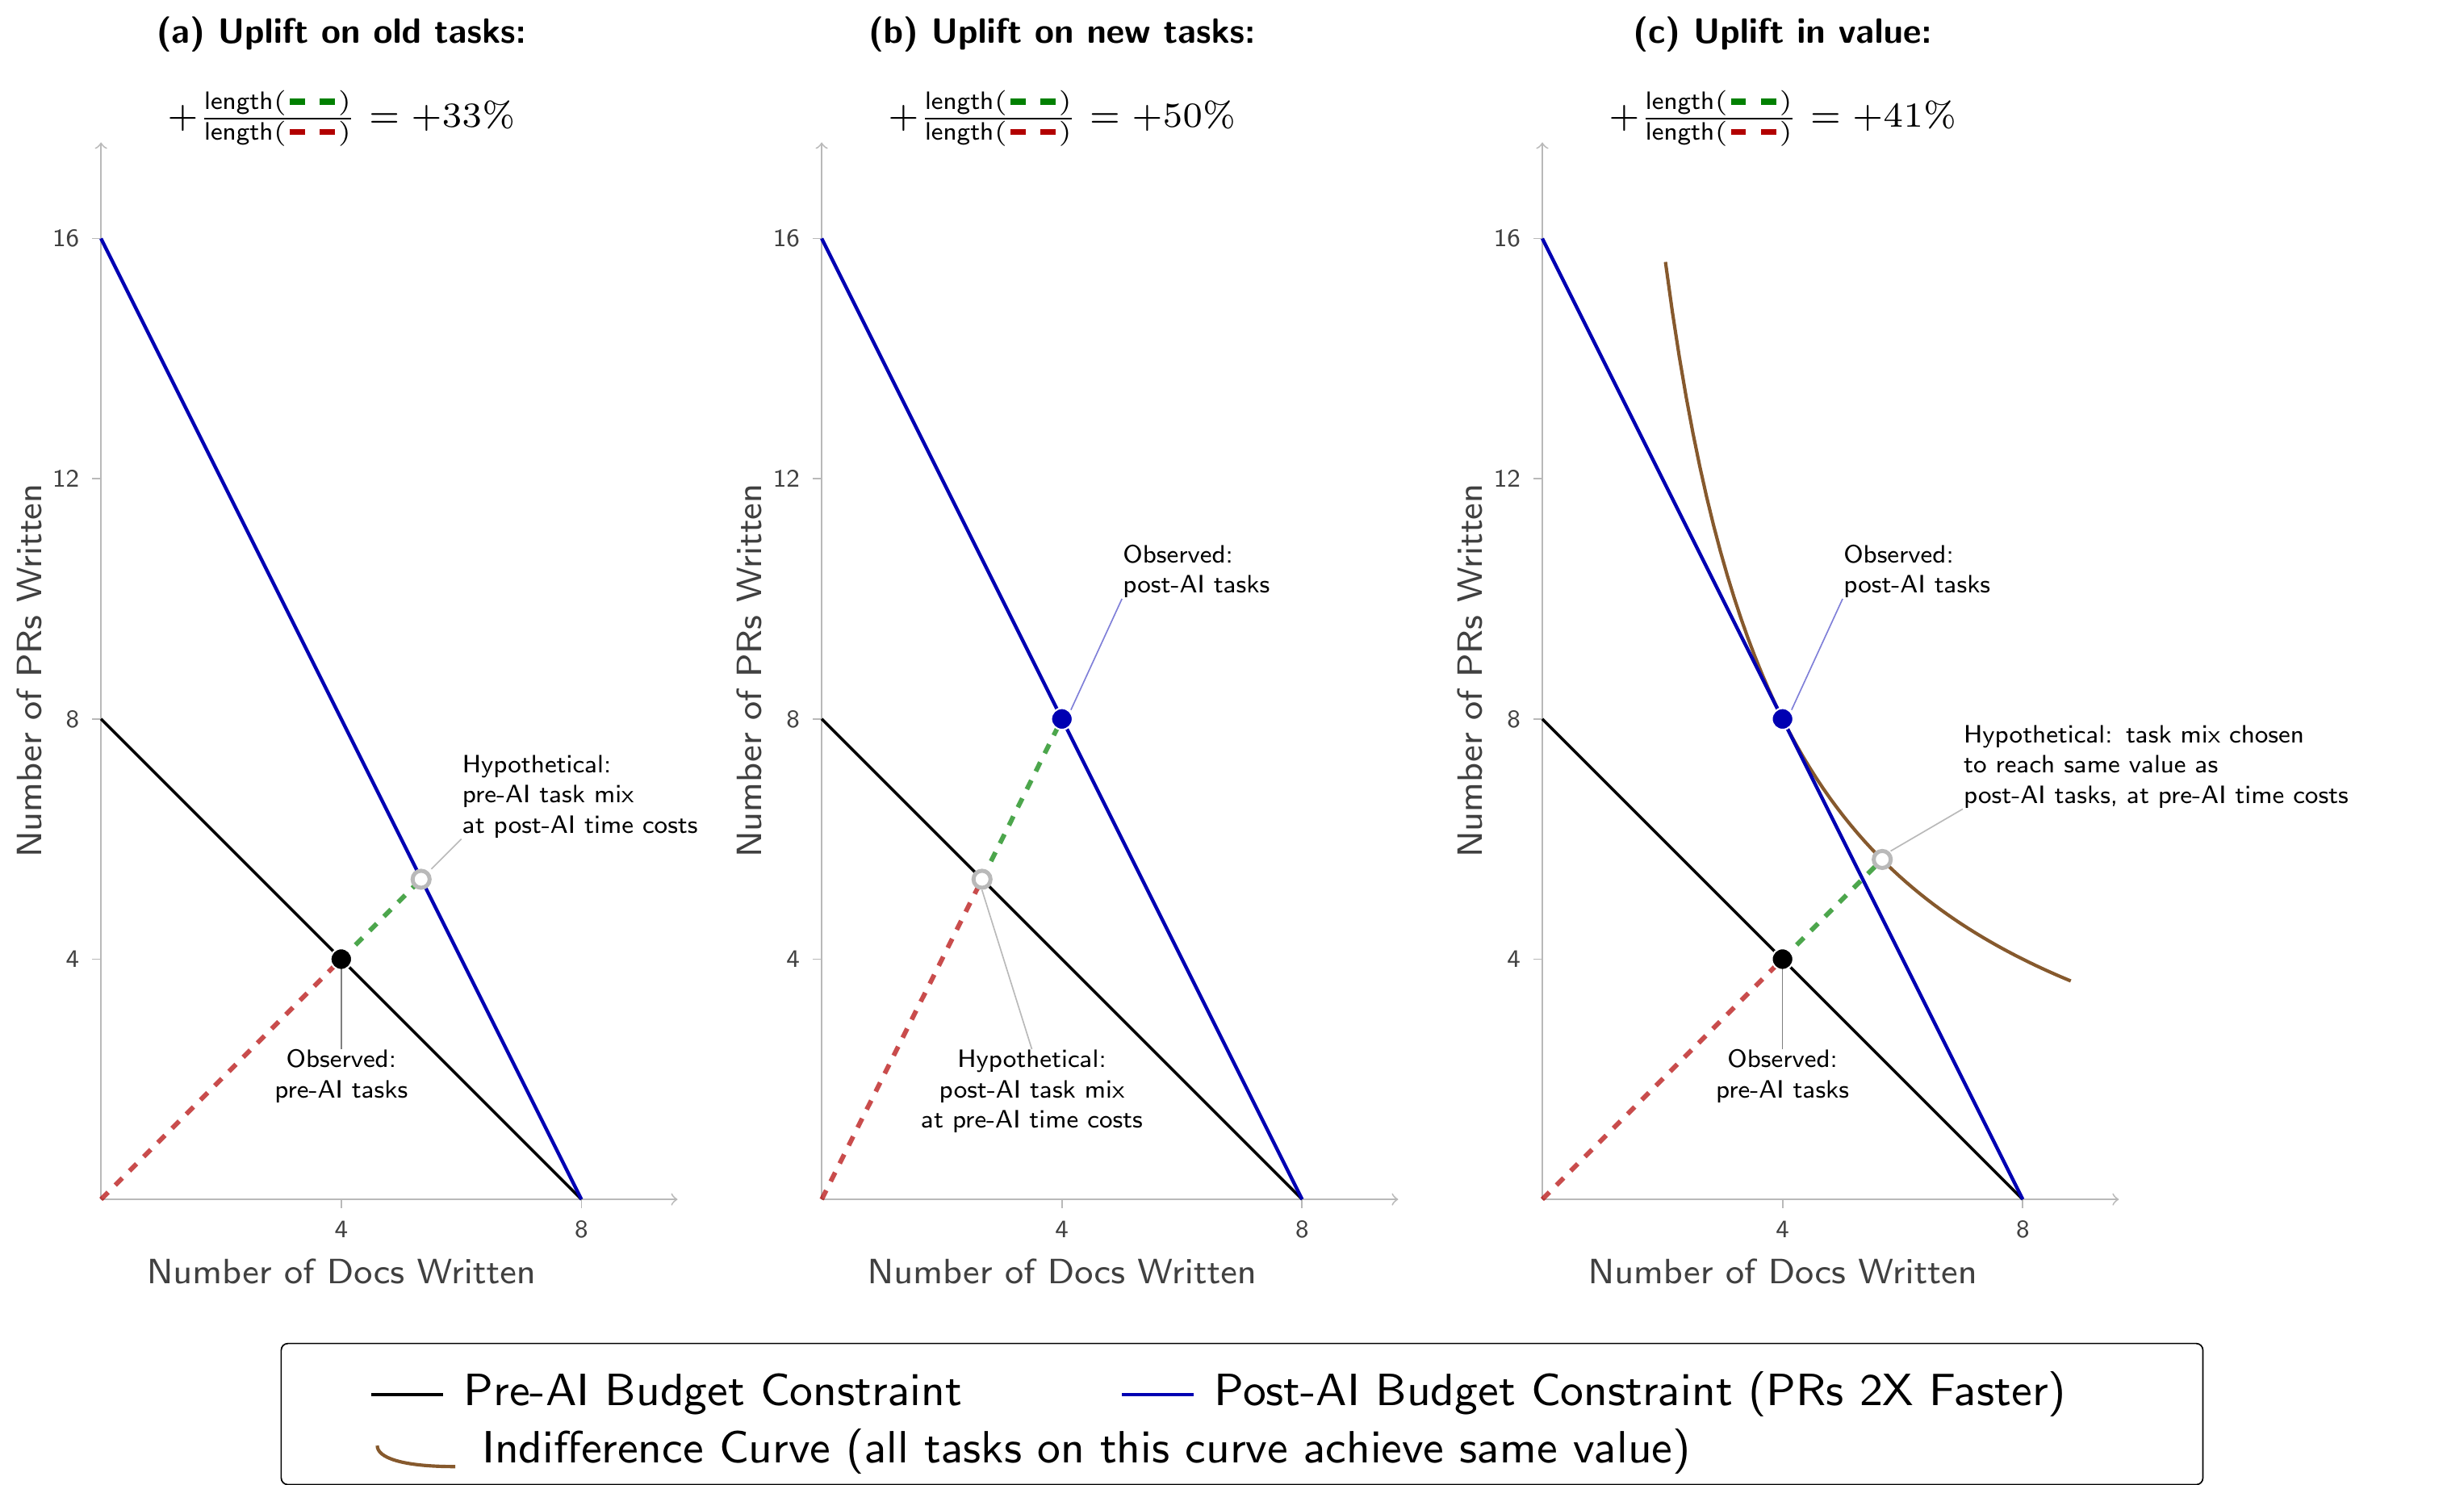
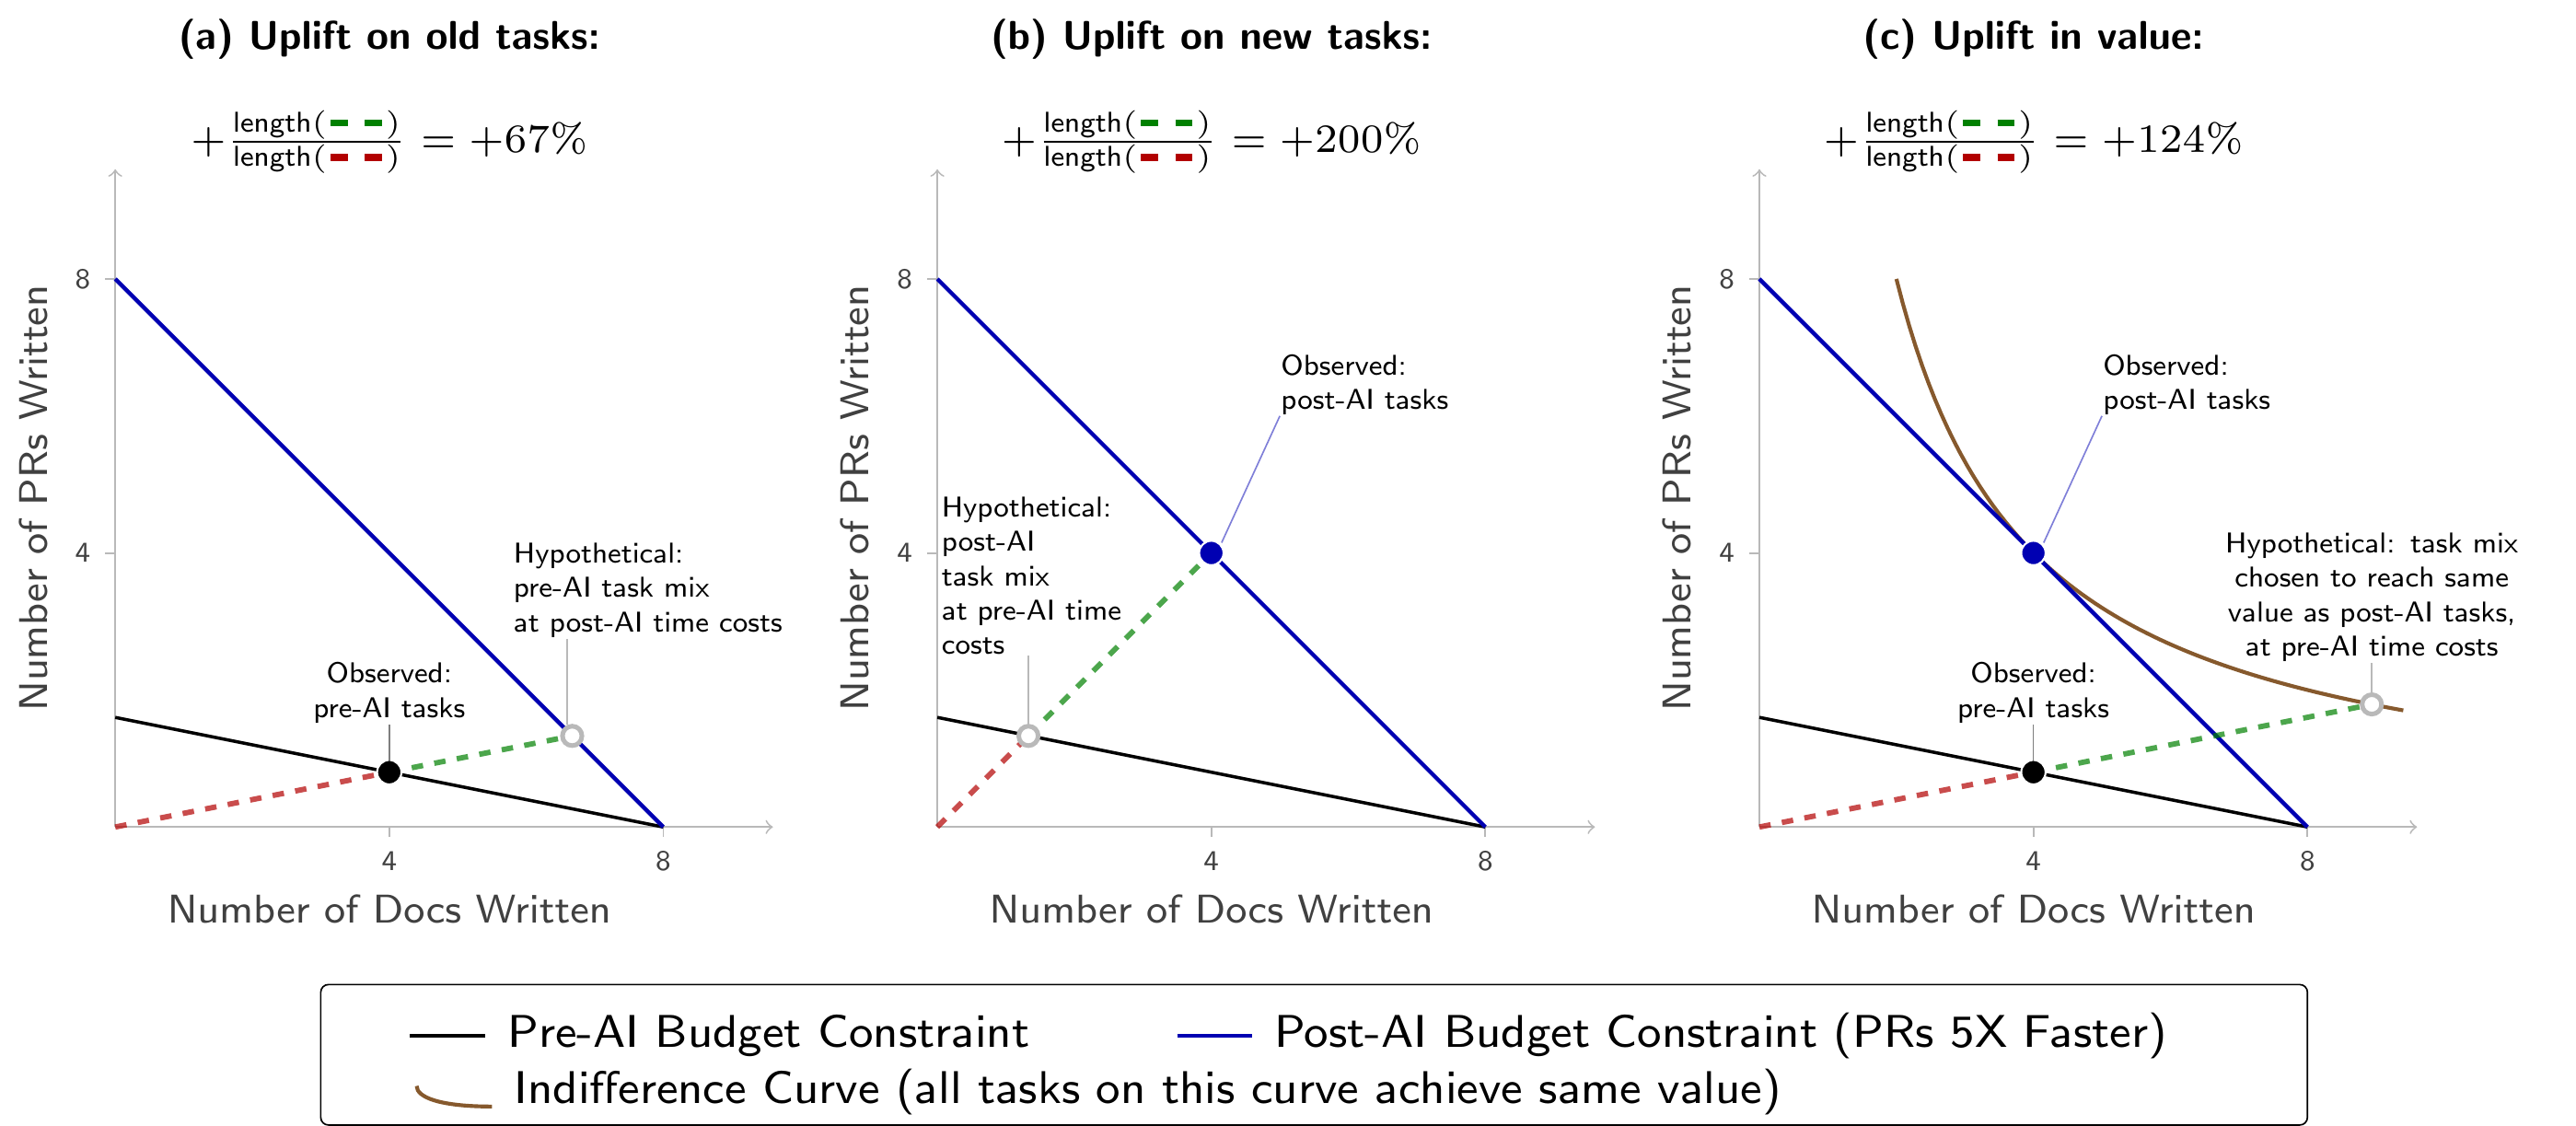
To get some graphical intuition, let’s suppose that value for the software engineer is \(\text{value} = \sqrt{\text{number of docs} \times \text{number of PRs}}\), and they choose their tasks to maximize value. Figure 1 shows the three measures. Subfigure (a) shows uplift on old tasks: this takes the old tasks and compares it to a hypothetical world where AI changes the time costs of each activity but the software engineer does not get to change the relative amount of PRs and docs they do. Subfigure (b) shows uplift on new tasks: this takes the new tasks and compares it to a hypothetical world where time costs return to pre-AI levels but the software engineer does not get to change the relative amount of PRs and docs they do. Subfigure (c) shows uplift in value: this takes the old tasks and asks “how much more time would I need pre-AI to produce as much value as I get from the new tasks?”
In all subfigures, the dashed lines connect points with the same ratio of docs to PRs. Along any such line, distance from the origin is proportional to total time cost: for example, the tasks (2 docs, 2 PRs) take exactly twice as much total time as the tasks (1 doc, 1 PR), and the line to (2, 2) from the origin is also twice as long as the line to (1, 1). The red segment is proportional to the baseline time cost and the green segment is proportional to the additional time cost, so \(\text{uplift} = 1 + \frac{\text{length(green)}}{\text{length(red)}}\).
A More Extreme Example
In Figure 1 the bounds given by uplift on old and new tasks are reasonably tight. This is driven by the small change in relative time costs. Figure 2 shows that if we increase the change in relative time costs, the bounds become looser.
Suppose that pre-AI, a doc takes 1 hour and a PR takes 5 hours, while post-AI both take 1 hour (PRs are \(5\times\) faster). Continue to suppose they have the same value equation. The uplift measures now span a much wider range: \(+67\%\), \(+124\%\), \(+200\%\).
Comparing with Existing Productivity Measurements
Tamkin and McCrory (2025) estimate that using the Claude chatbot causes a roughly \(17\%\) aggregate productivity increase. Their logic is as follows:
- Claude is regularly used for around \(11\%\) of wage-weighted O*NET tasks (based on classifying Claude queries to O*NET tasks, and weighting them by the pre-AI distribution of tasks).
- When Claude is used, the time required to do a task falls by \(80\%\) (using chatbot transcripts mapped to O*NET tasks, and LLM estimates of the time required with and without Claude)
- Assuming an elasticity of substitution of 1 (Hulten’s theorem) the implied output gain is around \(17\%\) (\(\approx 0.11 \times \ln(5)\)).
In this case the basket of tasks is taken from the old tasks (O*NET), so we might expect the resulting estimate to be a lower bound on the true uplift.3
In fact we think the estimate is likely an overestimate for another reason. We can distinguish between a task and a task-group (ONET tasks), where each task within a group has its own time-cost and value. The 5X time-saving estimates are for specific tasks (Claude queries). If these time-savings were representative of all tasks in that ONET task group (both pre-AI and post-AI) then the conclusion would be valid. However it seems likely there is substantial substitution within task groups, towards those which have higher time-savings. Consider two examples given in the notes:
- “Translate this paragraph into French …”
- “Given this source material, can you write a memo?”
It seems plausible that both (1) there is a 5X speedup from using Claude to do these specific tasks; (2) the share of time in the associated ONET tasks (tasks group) remains roughly constant.4 Yet it also seems unlikely that the 5X speedup applies to all of a person’s old tasks in the associated ONET group. If there is sufficiently extensive substitution within ONET task-groups, then an arbitrarily high speedup on observed tasks is consistent with an arbitrarily small uplift in value, due to within-group task substitution.
A separate point, mentioned in the original article, is that the queries observed by Claude represent only a subset of the new tasks, and that subset is likely to have a higher speedup, for selection reasons (you are more likely to use Claude for a task if Claude will speed you up more).
Cadillac Tasks
The gap between uplift on new tasks and uplift in value is especially relevant when considering the impact of AI when the time-cost of some tasks collapses. For example, AI coding agents are now able to complete some days- to weeks-long software engineering projects autonomously.5 Therefore, we should expect people to substitute towards tasks that take advantage of AI. Their uplift on new tasks will be very high, but their uplift in value may be much lower. In the case where the uplift in value is much lower and the person is only doing the task because AI has made it cheap, we have been calling it a “Cadillac Task”.
-
The inequalities are due to Konüs (1924), a recent reference is Diewert (2017). Our “value uplift” could correspond to the cost-of-living index with either the old or new-utility level. But if the utility function is homothetic then those two quantities will be identical. ↩
-
Among other things: (1) a person’s time-allocation decisions reflect their perceived uplift across tasks, not real uplift; (2) time-allocation can reflect expectations about the future rather than present productivity, e.g. due to learning curves and explore-exploit decisions; (3) dividing time into tasks is often highly subjective, there is no canonical economic way of individuating tasks; (4) appropriately incentivizing decision-makers to maximize their productivity is very difficult. Some of these considerations could cause the inequalities to reverse in practice, e.g., uplift on new tasks could be lower than on old tasks if these other factors caused sufficiently large changes in time allocation. ↩
-
Appel et al. (2026) discusses upper and lower bounds with different elasticities of substitution, but again uses ONET task as the unit of analysis, i.e. assuming that all tasks within an ONET group have the same speedup factor. ↩
-
Plausible ONET tasks: 27-3091.00 Interpreters and Translators, task: “Read written materials, such as legal documents, scientific works, or news reports, and rewrite material into specified languages.” 43-6011.00: “Prepare invoices, reports, memos, letters, financial statements, and other documents, using word processing, spreadsheet, database, or presentation software.” ↩
-
See MirrorCode for evidence on this. MirrorCode tasks involve reproducing existing software, which is a specific task type and not necessarily representative of software engineering in general. ↩